Did Canadian pay keep up with groceries and rent?
Canadian pay rose 33% since January 2019 and all prices rose 27%, so pay won on average. But groceries, rent and car insurance rose faster than pay, and those are bills nobody can skip.
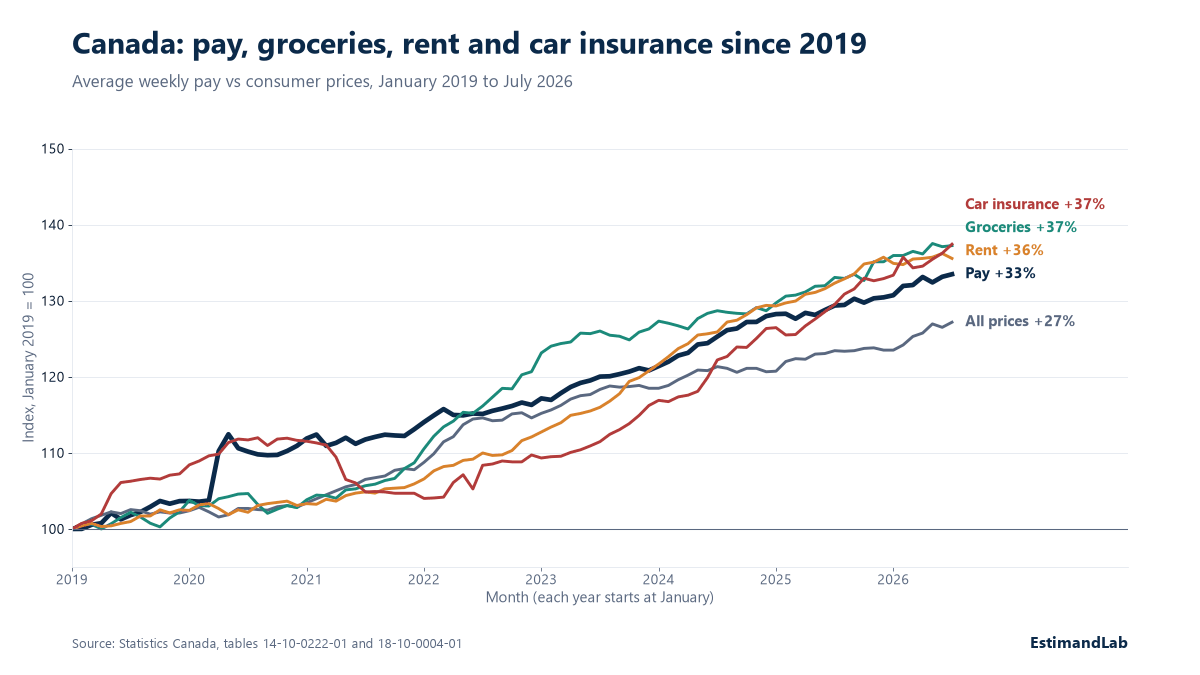
Canadian pay rose 33% between January 2019 and July 2026, while consumer prices overall rose 27%. Pay beat prices on average, yet groceries (+37%), rent (+36%) and car insurance (+37%) all grew faster than pay.
That split is the finding. An average household did gain buying power. A household whose budget is mostly food, rent and a car lost some.
The numbers
Each series is set to January 2019 = 100 and measured to July 2026, the latest month of pay data in the table when we checked.
| Item | Change since January 2019 |
|---|---|
| Average weekly pay | +33.5% |
| All consumer prices | +27.2% |
| Groceries (food from stores) | +37.2% |
| Rent | +35.6% |
| Car insurance premiums | +37.4% |
Divide pay growth by price growth and a week’s pay buys about 5% more of the average basket than in 2019. The same pay buys about 3% less groceries, 1.5% less rent and 3% less car insurance than it did.
The consumer price figures are now available to September 2026. Against January 2019 they read: all prices +27.2%, groceries +35.7%, rent +37.3%, car insurance +38.2%. Groceries eased and rent and insurance rose, so the reading is the same. Statistics Canada schedules August pay for 29 October 2026, and we will update when the table opens.
Why it happened
The tables record what happened, not why. Our reading is that the three fastest bills share one trait. A household cannot cut food, shelter or the insurance a lender or the law requires, so sellers can raise prices with little loss of customers. Pay moves with the labour market, and the labour market does not set these prices.
What it means
For a household, the headline “pay is ahead of prices” does not describe your budget. Work out your own mix. If groceries, rent and insurance take more than half of your spending, your real change is lower than 5%. Where your province has private insurers, get car insurance quotes every year.
For an employer, a pay review tied to headline inflation can miss what staff feel. Add the price of food, rent and insurance to the review, and you see where your staff are falling behind.
For a policymaker, support aimed at the whole price level reaches people who did not fall behind. Support aimed at the three items reaches those who did.
Limits
Pay here is average weekly earnings, which also moves with hours worked and with who has a job. The price indexes track a fixed basket, and the rent index covers rents paid by existing tenants, not only new leases. The start month matters. Ending in a different month, or starting in a different year, moves the gaps by a few points, but not the order.
Sources
- Statistics Canada, table 14-10-0222-01, average weekly earnings including overtime, all employees, Canada, seasonally adjusted (vector v54027306), https://www150.statcan.gc.ca/t1/tbl1/en/tv.action?pid=1410022201 (checked 2026-10-29)
- Statistics Canada, table 18-10-0004-01, Consumer Price Index, all-items, food purchased from stores, rent and passenger vehicle insurance premiums (vectors v41690973, v41690975, v41691052, v41691141), https://www150.statcan.gc.ca/t1/tbl1/en/tv.action?pid=1810000401 (checked 2026-10-29)
- Statistics Canada, release calendar, "Payroll employment, earnings and hours, August 2026", 29 October 2026, https://www150.statcan.gc.ca/n1/dai-quo/cal2-eng.htm (checked 2026-10-29)
We first posted this finding on X: https://x.com/EstimandLab/status/2115185942755762371