US car insurance is up 49% since 2019, pay up 37%
US car insurance prices are up 49% since January 2019, against pay up 37%. Car insurance outran pay by the widest margin of any household bill we checked. Shop the policy every year.
US car insurance prices are up 49% since January 2019, and average hourly pay is up 37%. Of the household bills we compared, car insurance outran pay by the widest margin.
Shop your policy every year. The average premium moved far more than pay did, and quotes for the same driver differ by insurer.
The numbers
Each series is set to January 2019 = 100 and measured to September 2026, seasonally adjusted. The pay series is average hourly earnings of private-sector employees.
| Item | Change since January 2019 |
|---|---|
| Car insurance | +48.8% |
| Rent | +38.5% |
| Average hourly pay | +37.0% |
| All prices | +33.2% |
| Groceries | +32.9% |
Car insurance rose 12 points more than pay, so an hour’s pay buys about 8% less car insurance than in 2019. Rent is also ahead of pay, by a point or so. Groceries and all prices are behind it.
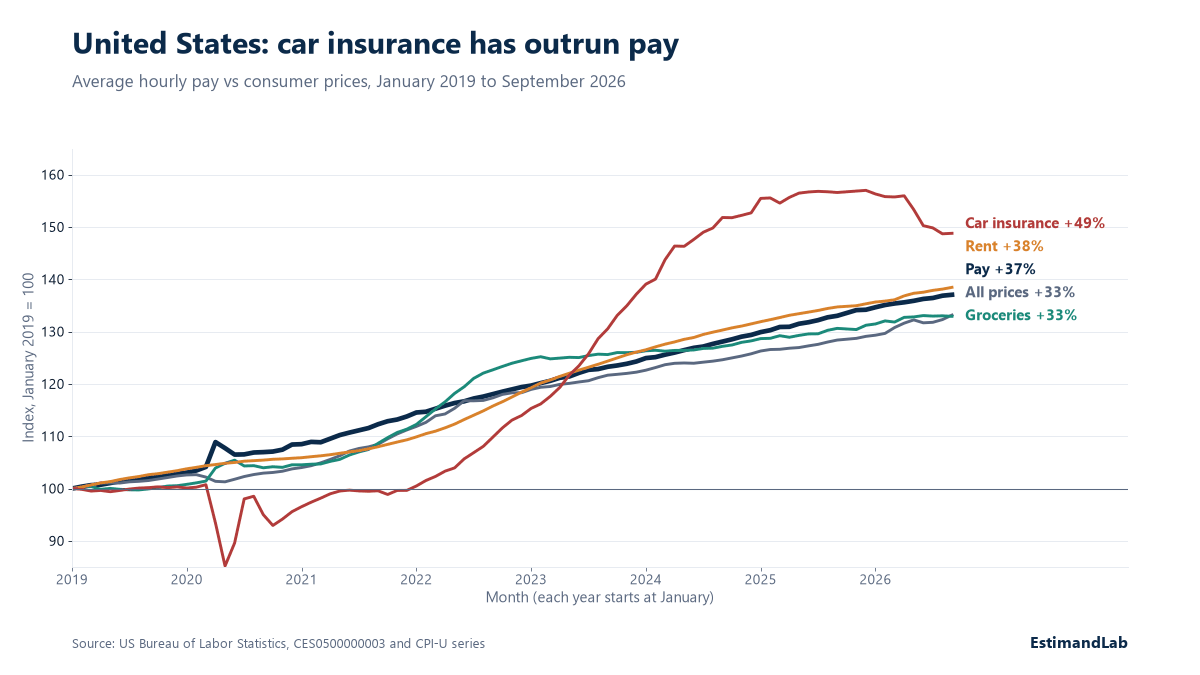
The line for car insurance is not a steady climb. It fell to about 85 in spring 2020. It then rose steeply from 2022 and peaked near +57% in December 2025. It has eased about 5% since, to +49%. The BLS series has no value for October 2025, and the chart joins the line across that gap.
Why it happened
The tables show premiums, not their causes. Our reading is that insurers price what they expect to pay out, and what they pay out for a crash is mostly repair and replacement cost. The companion series on car repair is up 61% over the same period. See US car repair prices are up 61% since 2019. Premiums rose alongside those costs. The 5% fall since the peak shows that premiums can come down, which is one more reason to ask again each year.
What it means
For a household, premiums are set company by company, and quotes for the same driver differ. Get at least three quotes each year, and compare the same coverage and deductible. Do it before renewal, when you can still switch.
For a business that runs vehicles, our reading is that insurance now takes a larger share of fleet cost than in 2019. Rebid it and track claims, because a better claims record is the one input you control.
For a policymaker, a bill that rises 12 points faster than pay, with the buyer unable to go without it, is a case for scrutiny of how premiums are set and how easily drivers can compare them.
Limits
The index measures prices for a constant package of coverage, not what a given driver pays after changing deductible, coverage or insurer. Pay is an hourly average and does not capture hours. January 2019 is a reasonable start, but starting in the 2020 dip would make the rise look much larger, so the base month matters.
Sources
- US Bureau of Labor Statistics, CPI-U seasonally adjusted: CUSR0000SA0 (all items), CUSR0000SAF11 (food at home), CUSR0000SEHA (rent of primary residence), CUSR0000SETE (motor vehicle insurance), https://www.bls.gov/data/ (checked 2026-10-29; September 2026 is the latest month)
- US Bureau of Labor Statistics, CES0500000003, average hourly earnings of all employees, total private, seasonally adjusted, https://www.bls.gov/data/ (checked 2026-10-29; September 2026 is the latest month)
- US Bureau of Labor Statistics, CPI-U CUUR0000SETD, motor vehicle maintenance and repair, https://www.bls.gov/cpi/data.htm (checked 2026-10-29)
We first posted this finding on X: https://x.com/EstimandLab/status/2115228828146807233