Why are US utility bills rising faster than pay?
Since January 2019 US electricity prices rose 47%, piped gas 47% and water, sewer and trash 39%. Pay rose 37% and all prices 34%. Here is why and what it means.
Utility bills are the household costs with the least room for choice, and they have outrun pay. Since January 2019, US electricity prices are up 47%, piped gas 47% and water, sewer and trash 39%. Average hourly pay is up 37% and all consumer prices 34%.
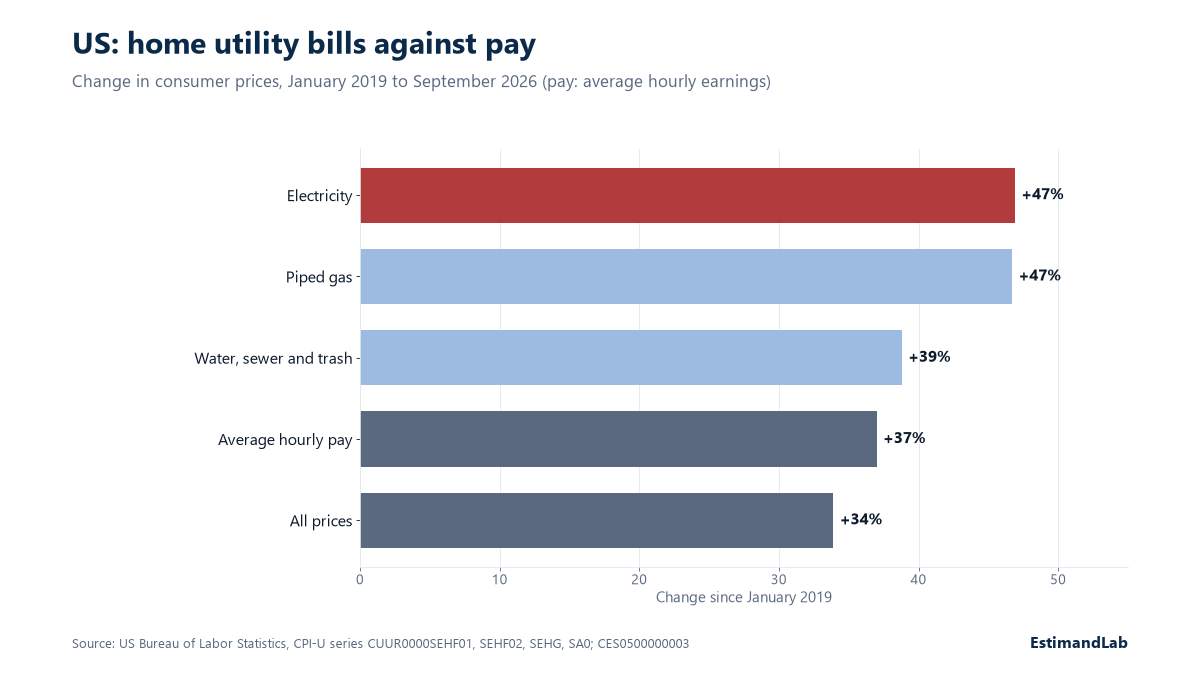
The numbers
| Change, January 2019 to September 2026 | Since 2019 | Past 12 months |
|---|---|---|
| Electricity | +47% | +4.4% |
| Piped gas | +47% | +5.0% |
| Water, sewer and trash | +39% | +4.8% |
| Average hourly pay | +37% | +3.0% |
| All prices | +34% | +3.7% |
September 2026 is the latest month. The October figures are due on November 10 [1]. The last 12 months matter because the gap is still widening. Each utility rose faster than prices overall and faster than pay in the past year, so the 2019 gap is not closing.
These are prices per unit of electricity, gas or water, not total bills. A household that uses less can still pay more per unit.
Why
The US Energy Information Administration expects the average residential electricity price to be 18.2 cents per kilowatt-hour in 2026 and 18.7 cents in 2027, up from 17.3 cents in 2025 [2]. It says retail prices are strongly influenced by natural gas prices and weather. It also says they include transmission and distribution upgrades and, in some regions, the prices set at capacity market auctions [2].
Our reading is that these are prices a household cannot shop around. In most places one local utility delivers the service and a regulator approves its rates, so a household cannot switch supplier the way it can with a phone plan. Fuel and weather move the price, and the cost of upgrades and capacity sets how much of it households carry.
What it means
For a household. Usage is the only lever most people have. Check whether your utility or state offers efficiency programs and bill assistance, and ask what the next rate case will do to your rate. For a business. Treat energy as a cost line that will rise faster than wages. Efficiency projects such as lighting, heat pumps and controls pay back sooner when rates are higher. Test the payback in the ROI and payback calculator, and enter the rate increase you expect, not today’s rate.
For an investor. Regulated utilities ask for higher rates to fund their upgrades, and regulators decide how much to grant. The size of those approvals, and the political reaction to them, is the number to track.
For a policymaker. Rate cases and capacity auctions are where these bills are set. Scrutiny belongs there, with evidence on what each upgrade costs and what it delivers to customers. That is an evaluation job, and program evaluation is how it gets done.
The limits
A national average hides large differences between states and between customers. The data measure price per unit, not what a household pays, and January 2019 is a starting point we chose, not a neutral baseline.
Sources
- US Bureau of Labor Statistics, Consumer Price Index, series CUUR0000SEHF01, CUUR0000SEHF02, CUUR0000SEHG, CUUR0000SA0 and CES0500000003, https://www.bls.gov/cpi/data.htm, and "Consumer Price Index, September 2026", https://www.bls.gov/news.release/cpi.nr0.htm (checked 2026-10-29)
- US Energy Information Administration, Short-Term Energy Outlook, October 2026, https://www.eia.gov/outlooks/steo/report/elec_coal_renew.php (checked 2026-10-29)
We first posted this finding on X: https://x.com/EstimandLab/status/2115573756102086931